Why Hand & Stone
Join Our Thriving Massage & Spa Franchise
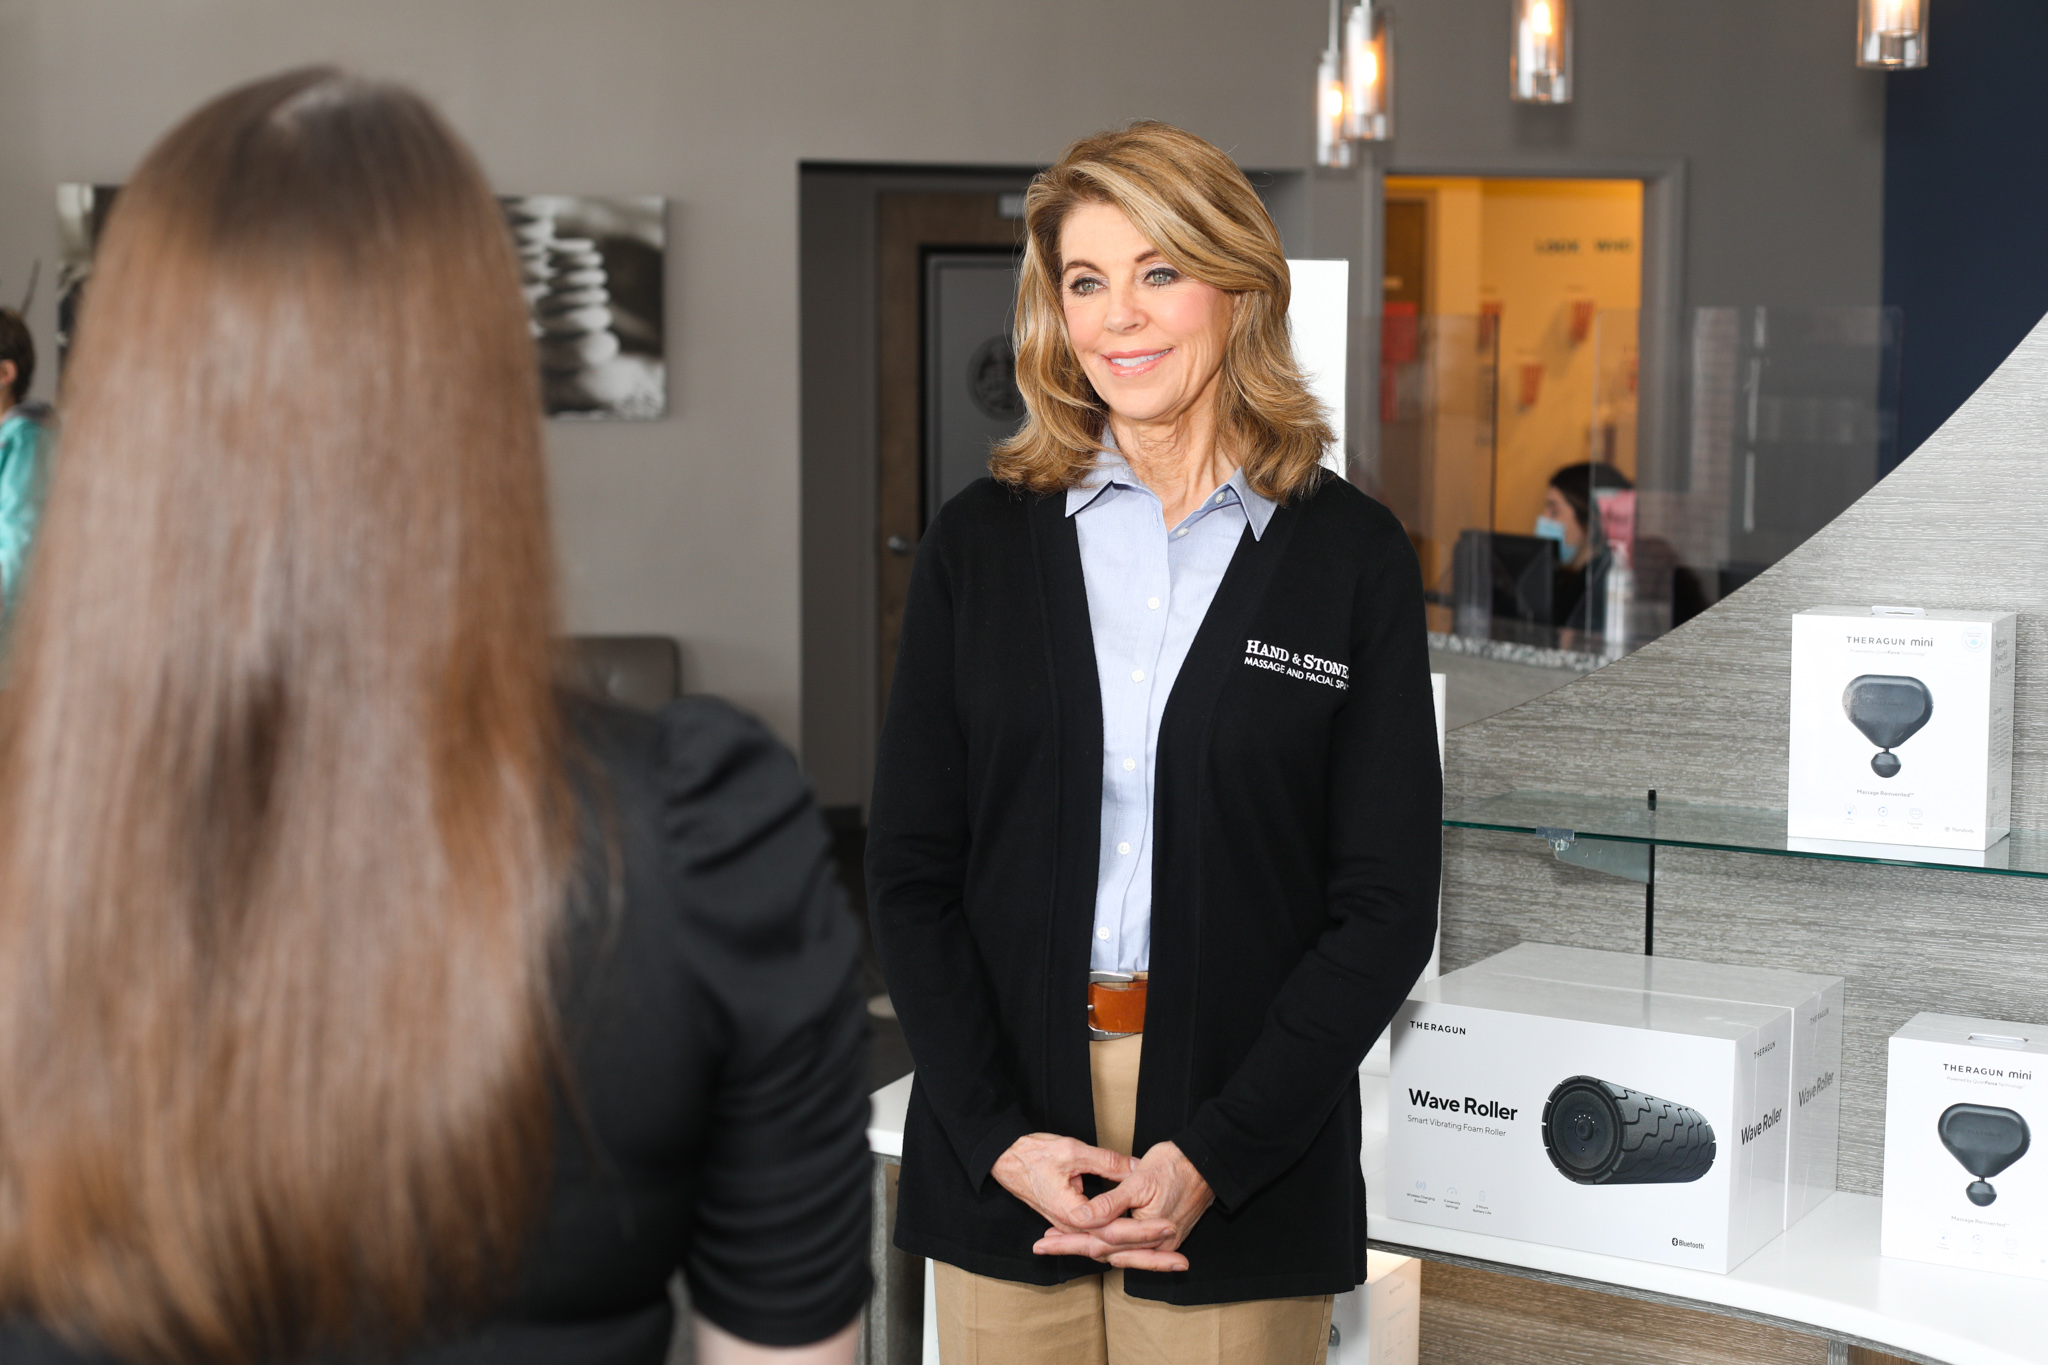
To ensure a successful and healthy franchise relationship, it’s mutually beneficial for you and the company you franchise with to be the best possible fit for one another. At Hand & Stone Massage and Facial Spa, we want to work with driven owners who share our mission, values, and passion for wellness and self-care. If you are seeking an exciting opportunity that will allow you to grow, thrive, and build a future for yourself, our spa franchise opportunity should be your first choice.
Hand & Stone is more than just a spa – we are a health care business and offer services that are resistant to internet competition. Our membership model allows for predictable and recurring cash flow and our 15+ years of experience ensure our brand will survive as leaders in the wellness industry.
Our massage and skincare spa franchise offers:
- A differentiated revenue model
- Advanced technology and unique service offerings
- Extensive start-up and ongoing support
- HSM Advertising services
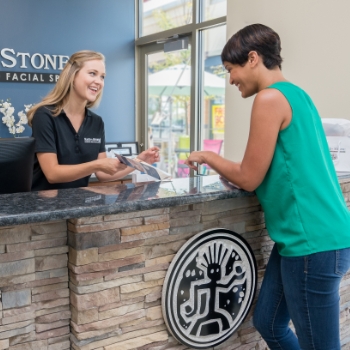
- A membership model that ensures repeat customers
- Full-service advertising and comprehensive training
Our massage and spa franchise is a leader in our industry and stands out from the competition for the reasons above and many more. From being named a 2019 Top Franchise to Own by Forbes to ranking #94 in Entrepreneur’s Franchise 500, Hand & Stone leads the industry in product quality, customer service, and franchisee satisfaction.
Our executive team and staff have a combined 250+ years of experience. Our CEO, John Teza, is a 25-year franchise industry veteran who brings to Hand & Stone franchise leadership experience having successfully grown other national franchise brands.
Hand & Stone location growth over the last 15 years*
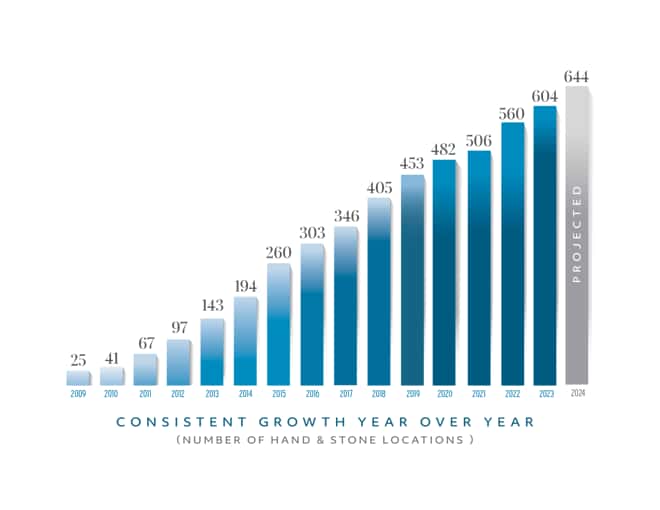 *includes Canadian spas
Ready to get started? Visit our Steps to Ownership page!
Table #7***
Corporate Spa Average Revenue and Expenses for Fourteen(14) Subsidiary
Outlets for the Calendar Year 2023
|
Average |
Median |
#/% Attaining or Exceeding Average |
High/Low |
|
| Gross Sales | $2,156,024 | $1,947,740 | 6 and 42.9% | $1,259,152 / $3,422,872 |
| Labor and Benefit Costs | $997,807 | $968,703 | 6 and 42.9% | $623,232 / $1,511,219 |
| Occupancy Costs | $141,054 | $136,070 | 6 and 42.9% | $99,637 / $180,255 |
| Royalties/National Marketing | $149,083 | $136,342 | 6 and 42.9% | $88,141 / $239,601 |
| Other Operating Costs | $384,143 | $358,557 | 5 and 35.7% | $292,465 / $581,548 |